CO2 reduction
What are the results in Wassenaar when it comes to CO2 reduction?
On the Rijksoverheid website you will find the latest known results of CO2 reduction in Wassenaar. The data is based on the climate monitor. Here you can use a specially designed dashboard to see where Wassenaar is coming from in terms of CO2 emissions and what the current state of affairs is. Also included are relevant figures dealing with matters related to CO2 reduction, such as numbers of electric cars and energy labels of homes. The most recent figures are sometimes 2 years old. The figures on this website and the local policies of the municipality of Wassenaar cannot be translated one on one. On the one hand because there is a delay in the data, on the other hand because economic effects, national and regional policy or social movements all contribute to the figures.
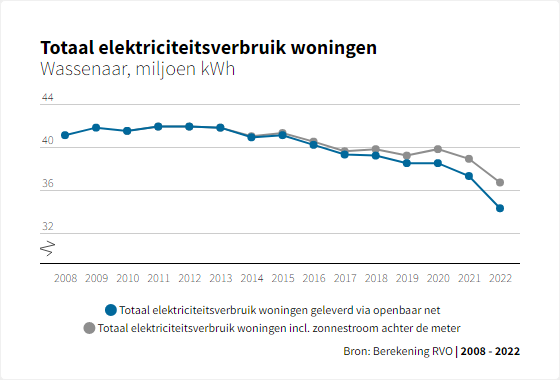
Table showing data between 2008 and 2022. The table shows that total residential electricity consumption in Wassenaar decreased between 2008 and 2022. This applies to both public grid and solar electricity use.

Table showing data between 2008 and 2022. The table shows that the total natural gas of homes in Wassenaar decreased between 2008 and 2022.
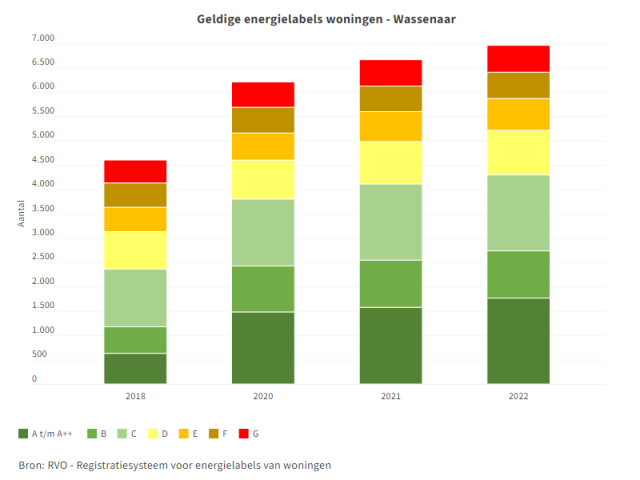
Table showing data of valid energy labels in Wassenaar between 2018 and 2022. During this period, an increase in increasingly fuel-efficient energy labels can be seen in homes.
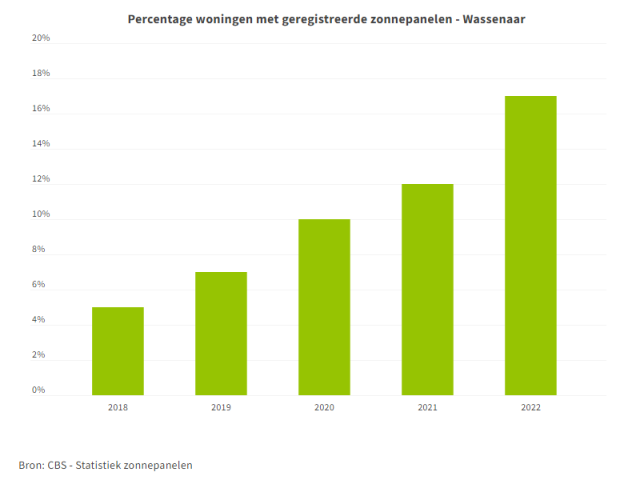
Table showing percentage of homes with registered solar panels in Wassenaar between 2018 and 2022. An increase in registered solar panels can be seen during this period.
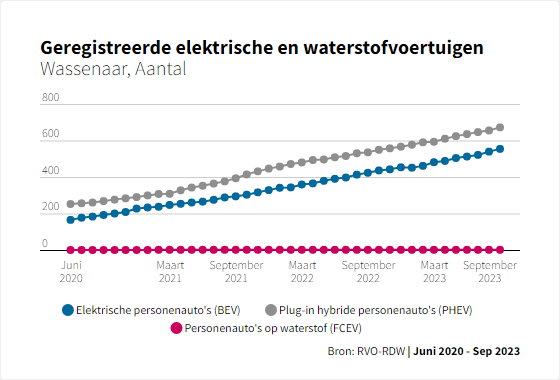
Table showing data of registered electric and hydrogen vehicles in Wassenaar between June 2020 and September 2023. A sharp increase in electric passenger cars and plug-in hybrid passenger cars can be seen between June 2020 and September 2023. The number of hydrogen-powered passenger cars is zero during this period.
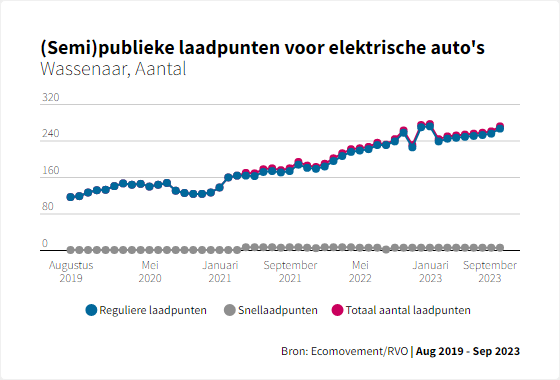
Table with given of public and semi-public charging stations in Wassenaar in the period August 2019 to September 2023. The number of fast charging points remained the same during this period. The number of regular charging points almost tripled during this period.
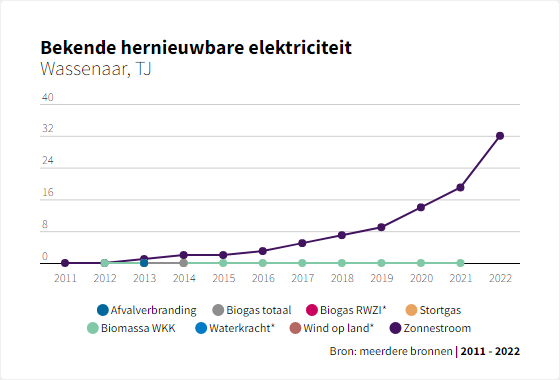
Table showing data of known renewable electricity in Wassenaar for the period 2011 through 2022. It shows a large increase (from 0 to 32) in solar electricity during that period.